Page Last Updated: April 18, 2026
HBCD Quality Control🔗
Click to learn more Project Management
Click to learn more Reproducibility
Click to learn more Transparency
Click to learn more
As part of one of the primary pillars of the HBCD Data Release Framework, we have a comprehensive quality control (QC) process that ensures all data released to the public is accurate, consistent, and reproducible. This process is designed to catch errors at multiple stages, from initial data entry through to final public release.
Pre-Release QC: 5 Stages🔗
The following outlines the 5 stages of QC performed for all study data prior to release. Below we outline the specific details of each stage associated with tabulated Behavior, Biology, & Environment data and file-based data for MRI & MRS and EEG.

Behavior, Biology, & Environment🔗
The majority HBCD data are provided as tabulated data, including demographics & visit information and study instruments. The QC processes outlined below describe processes for all HBCD Workgroups (see details) unless otherwise specified. Note that, in the context of tabulated instrument data, "processing" refers to scoring the data where applicable. Instrument-specific QC procedures are documented on the HBCD Data Release Docs site under the Administration & Quality Control section for each instrument page (e.g. see here).
Automated source QC is performed via REDCap, Ripple, and LORIS when site staff or participants enter the data. The following checks are performed:
Input Validation
Range Checks
LORIS
LORIS works with Workgroups to establish plausible value ranges (e.g. see Filtered Field Values for R1.0). For these variables, the following checks are performed:
- Enforce numeric bounds for all fields with defined minimum or maximum values.
- Automatically verify all date fields fall within protocol-defined windows.
- For derived fields (e.g., BMI), ensure source values are present and valid.
- Identify and flag inconsistent or reversed event sequences (e.g., follow-up before baseline).
Required Fields
REDCap
Ripple
To enforce completeness without violating participant autonomy, we treat all fields as *required* by including standardized non-answer response options. This enables complete data collection while capturing legitimate missingness and refusals.
-
Implementation Steps:
- For every field (except calculated fields or system-generated timestamps), ensure there is a valid value recorded.
- Include explicit non-answer choices-999 = "Don’t know"
-888 = "Refused to answer"
-777 = "Not applicable" in all multiple choice or dropdown fields. - Limit use of open text fields to ensure consistency, support downstream coding, and reduce manual data cleaning.
- Open text fields are prohibited by default unless:
- The field is explicitly designed for collecting novel, uncategorized input.
- The data cannot be anticipated or meaningfully pre-coded at design time.
- When text fields are used, they are treated as temporary input capture mechanisms for refining structured options.
- For any field that begins as free text:
- Responses are monitored regularly.
- Common answers are converted into predefined choices in future versions of the form.
- A structured dropdown or radio field is created, with an "Other, specify" option.
Handling of Special Codes in Standardized method
All non-response fields are confirmed to be using standardized special codes-999 = Don’t know
-888 = Refused to answer
-777 = Not applicable. In addition, checks are made to ensure that these codes are not used in computed or date fields.
Branching Logic Enforcement
REDCap
- Extract branching logic from the REDCap Data Dictionary.
- For each field with logic conditions:
- Identify records where data are present, but the logic condition is not satisfied.
- Flag violations where fields are populated outside of their visible state.
- For required fields inside conditional blocks, ensure logic has been triggered if data are expected.
Table & Variable Naming Schema Standardization & Validation
All variable names are parsed and validated against naming rules outlined here.
Staff/Site Violation Corrections & Workflow Improvements
Some non-complex scoring
Ingestion QC is performed when data is transferred from the capture source (i.e. REDCap or Ripple) to the central LORIS repository. It includes:
- Data tracking via LORIS and RBA Dashboards
- Ensuring what was saved in REDCap was successfully transferred to LORIS via scripts in ETL/LORIS
- Transfer warnings/errors via scripts in ETL/LORIS
- Completeness warnings via LORIS launch pad
Workgroups LORIS Site Staff
Pre-processing QC involves the following, performed by the indicated parties responsible:
| Responsible Party | |
|---|---|
| Outlier identification | Workgroups (via Tableau and DQTDictionary Query Tool) |
| Data entry corrections | HBCD Study Site Staff (generally after being notified by HDCC or WGs) |
| Answer distribution and missingness checks | Workgroups (via Tableau and DQTDictionary Query Tool) |
| Complex scoring not handled in REDCape.g. look up tables | LORIS |
QC Dashboards
Workgroups
Lasso
HST
Ripple
Workgroups perform processed data QC (on all data and site-specific data) via QC Dashboards to assess missingness, protocol compliance, and scoring calculation checks. The specific Dashboard utilized by each HBCD Workgroup is as follows:
| Tableau Dashboards (administered by Lasso) | Behavior and Caregiver-Child Interaction Biostatistics Neurocognition & Language Novel Technologies & Wearables Physical Health Pregnancy & Exposure, including Substance Use Social & Environmental Determinants |
| HST Dashboards | Biospecimens & Omics |
| Ripple | Geocoding & Linking External Data Transitions in Care |
Monthly Reports Submitted to Lasso
Based on the processed data QC performed via these dashboards, subject matter experts (SMEs) submit monthly reports to Lasso where they describe, for each issue identified, whether it impacts one variable or the entire instrument, the number of participants impacted, and at what level the required fix will need to occur (including data entry/collection at the site, scoring correction from LORIS or RedCAP, and/or new data import). After review, Lasso connects the Workgroup with the relevant parties to resolve them.
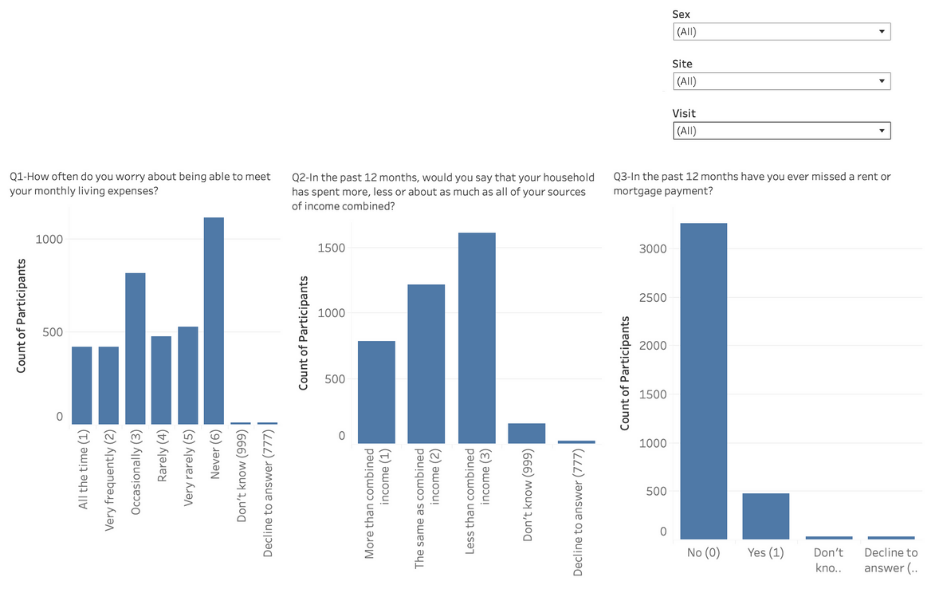
Example of Data View on Tableau Dashboard
Process Flow for Workgroups & Biostatistics
See this spreadsheet or expand section below for the Responsibility Assignment Matrix (RACI) outlining phases of tabulated data QC and validation and which organizations are responsible.
| Phase | Responsible Org+Group | Activity | Inputs | Outputs / Artifacts | Record System | |
|---|---|---|---|---|---|---|
| 1a | Instrument coding Specification | HCAC WGWorkgroup | Provide instrument specifications & scoring requirements | Email, PDF, scoring docs | Instrument spec + scoring rules | Confluence |
| 1b | HDCC-Biostats Authoring | HDCC-Biostats | Receive instrument from WG; author scoring code and perform initial validation | WG instrument specs | Validated scoring code + example outputs | Git (code) + Confluence |
| 1c | Provenance Capture | HDCC-Biostats | Store scoring code, examples, and validation notes | Scoring code, test cases | Versioned code + validation record | Git + Confluence |
| 1d | Instrument Build | HDCC-LORIS | Implement instrument and scoring logic in data capture system | Approved specs + scoring logic | Coded instrument and scoring | LORIS |
| 1e | Instrument Code Validation (WG) | HDCC-Biostats | Validate coded instrument and scoring implementation; submit to LORIS ticket centre | LORIS instrument | QC feedback / approval | LORIS |
| 1f | Formal Instrument Approval | HCAC WGWorkgroup | Final sign-off on coded instrument; submit issues via HDCC-QC Lasso Ticket Centre | Instrument validated by WG | Instrument approval | LORIS |
| 1g | Approval Provenance | HDCC-WG Liason | Publish signed approvals and version info | WG + Biostats sign-off | Immutable approval record | Confluence |
| 2 | Data Collection | HCAC: Site Staff | Begin data collection using approved instrument | Approved instrument | Raw study data | LORIS |
| 3a | Ongoing QC- Data Availability | HDCC-QC Lasso | Data becomes available in ongoing QC environment | Collected data | QC-ready dataset | Lasso Ongoing QC |
| 3b | Continuous HDCC Biostats QC | HDCC-Biostats | Run scheduled HDCC-Biostats QC scripts per instrument, including execution of scoring algorithm over item-level data to compare to scored fields in Lasso. Submit issues via HDCC-QC Lasso Ticket Centre. Dump run outputs into common repository. | Live data | QC metrics, flags, logs | Git (code) + Lasso HDCC-QC |
| 3c | Ongoing QC- WG Review (SME QC SOP) | HCAC WGWorkgroup | Perform ongoing QC in Lasso. Submit issues via HDCC-QC Lasso Ticket Centre | QC datasets | QC feedback | Lasso HDCC-QC |
| 3d | HDCC ticket review and corrections | HDCC-LORIS | All issues are logged in Monday.com and reviewed, managed, and corrected weekly at Monday Release Meeting with all release-associated staff | HDCC-QC tickets, WG, and HDCC inputs | Corrected and closed tickets | |
| 4a | Pre-release- BR Data Available | HDCC-LORIS | Prepare BRBeta Release and filtered datasets (validate against HDCC biostats Ongoing scoring) against gold standard. Dump run outputs into common repository put there by hdcc-biostats group. | QC-reviewed data | BR dataset | Lasso HDCC-QC |
| 4b | Pre-Release HDCC Biostats QC | HDCC-Biostats | QC BR dataset and publish release-specific QC R scripts. Submit issues reported in HDCC-QC Lasso Ticket Centre to Git | BR dataset | Release-tagged QC code | Git (per-instrument folders) |
| 4c | Pre-Release WG QC | HCAC WGWorkgroup | QC data in Pre-Release environment | BR dataset | Final QC feedback | Lasso HDCC-QC |
| 4d | Final Provenance Capture | HDCC-WG Liason | Publish WG sign-off for BR | Final approvals | Release provenance record | Confluence |
Lasso Ingestion
Lasso
Data ready for release is first ingested into Lasso. Errors in ingestion are addressed and the following checks are performed:
- Ingestion logs are queried to check for skipped sessions and insertion errors
- Quality Assurance (QA) of the file transfer UI and Globus transfer performed
Subject Matter Expert (SME) Sign-Off
Lasso
Workgroups
Lasso obtains final sign-off from Workgroups on datasets in their release-ready form, with applied filters, via the Lasso Pre-Release System:
- All SMEs review data in Lasso pre-release system and sign off prior to public release
- Instrument scoring, mins/maxes/BIV
- Missingness/Shadow matrix
- Data dictionary
- Known issues are documented
- Biostatistics WG also reviews data and data dictionary in Lasso pre-release system
- mins/maxes/BIV
- Descriptives (means, frequencies)
- Missingness/Shadow matrix
- Data dictionary
- Known issues are documented
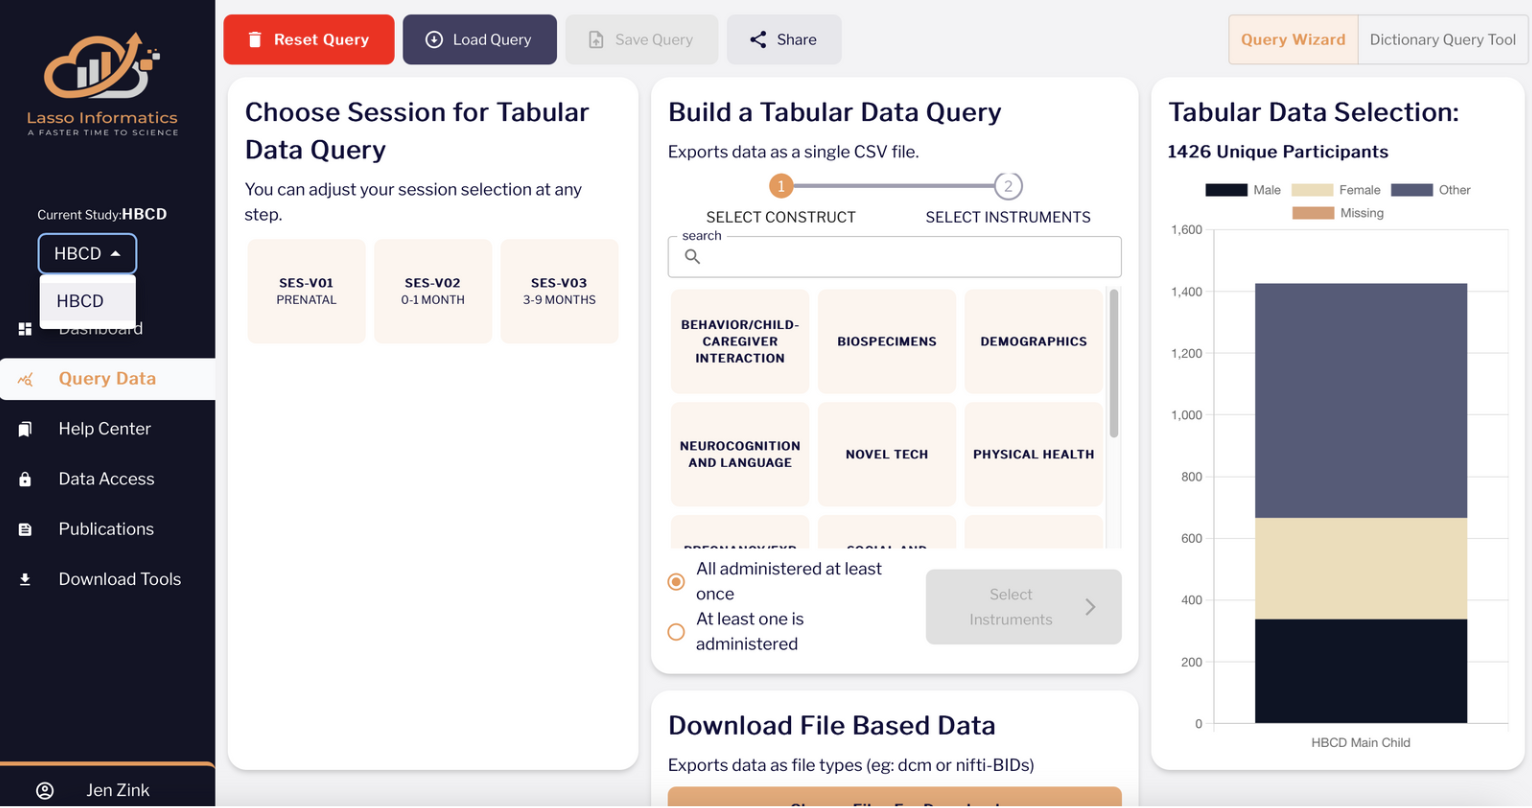
Example of Data View on Lasso Pre-Release System
MRI & MRS Data🔗
These data include both file-based and tabulated data for the instruments listed on the HBCD Data Release Docs site here.
-
Acquisition
- fBIRN phantom scans, used to monitor drift, occur either every day that an HBCD subject is acquired or weekly if the former is impractical. In terms of acquisition, the main criteria should be consistency. Sites with multiple operators are directed to discuss positioning of the phantom to make sure it is done in a similar manner every time. For weight, entering 100 lbs every time is recommended (age and height not needed).
- FIRMM software is used to monitor motion during acquisition.
- There are additional QC processes in place for when sites receive upgrades or a new scanner.
-
FIONA
- Updates patient ID by cross-checking against the Loris database to ensure no manual entry errors at the scanner
- Checks all expected files are on the transfer device
- Checks that all files were sent properly to their destination (UCSD: all DICOMs; UMN/HST: MRS/k-space)
- Data Tracking
The time of all data transfers at any given stage is documented and transfer completion is confirmed (monitored in LORIS).
As outlined in the data processing workflow diagram, raw data are sent via FIONA to UMN SCE/HST and HBCD Central/JCVI. Data are checked for protocal compliance and completion - see HBCD Data Release Docs for full details. In summary:
Protocol compliance
This is based on extraction of information from DICOM headers to identify common issues and protocol deviations (e.g. missing files or incorrect patient orientation). Criteria include whether key imaging parameters, such as voxel size or repetition time, match the expected values for a given scanner.
Completeness checks
A complete imaging session consists of the following valid series:
| Structural T1 Block: | T1 |
| Structural T2 Block: | T2 |
| Diffusion (dMRI) Block: | dMRI AP; dMRI PA |
| Resting state (rsfMRI) Block: | fMRI field map AP; fMRI field map PA; rsfMRI (run 1); rsfMRI (run 2) |
| MRS Block | SVS localizer; MRS |
| Quantitative (qMRI) Block | B1 Map; 3DMagic/QALAS |
AUTOMATED QC (see HBCD Data Release Docs for full details)
| Modality | QC Procedures |
|---|---|
| Structural (T1w, T2w, qMRI) | • Deep learning model estimates motion artifacts • Signal-to-noise ratio (SNR) computed |
| dMRI | • Framewise displacement (FD) for head motion • Head motion estimated via registration to tensor-synthesized imagesaccounts for contrast differences across orientations (Hagler et al. 2009) • Identification of dark slicesartifacts caused by abrupt head movements via RMS difference between raw and tensor-fitted data • Total slices and frames with motion artifacts calculated • Metrics for line artifacts and field-of-view (FOV) cutoff |
| fMRI | • FD for head motion (average FD and seconds with FD < 0.2 mm, 0.3 mm, 0.4 mm) (Power et al., 2012) • Metrics for line artifacts and FOV cutoff • FWHMFull width half max () spatial smoothness and tSNRtemporal SNR computed after motion correction (Triantafyllou et al. 2005) |
| Field Maps | • Metrics for line artifacts and FOV cutoff |
| All Modalities | • SNR computed where applicable |
MANUAL QC (see HBCD Data Release Docs for full details)
Data is selection for manual review based on multivariate prediction and Bayesian classifier. Manual review involves scoring images based on severity of the following artifacts:
| Modality | QC Procedures |
|---|---|
| T1w, T2w | • Scored for motion artifacts (e.g., ripples, blurring) on a 0-3 scale (0 = none, 3 = severe) • Other documented issues include intensity inhomogeneity and ghostingfaint displaced copy of anatomy due to slices outside FOV |
| qMRI | • Same artifact scoring as above (0 - 3) • Inspection of derived data (parametric maps, ROI analysis, and quantitative comparisons for 3D-QALAS) |
| B1 field maps | • Visual inspection and overall QC only; used for bias field correction of qMRI scans. |
| SVS localizer scans (MRS) | • Visual inspection and overall QC only; used to define ROI for spectroscopy. |
| dMRI, fMRI, field maps | • Scored for susceptibility artifacts, FOV cutoff, and line artifactshorizontal lines present in the sagittal view, including dark slice-frame and interleaved sliced offset. • Susceptibility issues include signal dropoutConsistent with prior infant fMRI using posterior-anterior (PA) acquisitions, signal dropout is commonly noted in the posterior occipital cortex, signal bunching, and warping. |
Modality-Specific Worfklow Details

QC is performed on processed MR data using several automated and manual approaches:
- AUTOMATED QC
MRI Workgroups
| QSIPrep pipeline (dMRI) | QSIPrep produces robust QC metrics - see Automated QC for Processed Diffusion Data for details. |
| XCP-D pipeline (sMRI/fMRI) | XCP-D produces several QC metrics and visual reports to aid in data evaluation. One key metric is framewise displacement (FD), which quantifies head motion across the scan. For each run, the amount of low-motion data, based on an FD threshold of 0.3 mm, is calculated. Only runs with at least 210 seconds of low-motion data are retained in the final outputs. |
| MRIQC utility | MRIQC extracts image quality metrics, provided in the release data, from structural and functional MRI - see details. |
Lasso obtains final sign-off from the MRI Workgroups on datasets in their release-ready form, with applied filters, via the Lasso Pre-Release System. The following checks are performed:
Structural MRI
CDNI
Processed structural MRI data, based on tabulated data derived from XCP-D outputs, were analyzed using R-based scripts. ROI-level measures included:
- Cortical metrics (Gordon parcellation, 333 ROIs): cortical thickness, surface area, and curvature
- Subcortical metrics (Freesurfer segmentation, 19 ROIs): volume
Functional MRI
CDNI
QC performed for processed resting-state fMRI (rs-fMRI) data, derived from XCP-D outputs, is performed on both tabulated and file-based data. Analyses leverage R-based scripts and BrainSwipes QC outputs.
Tabulated Data
We analyzed ALFF and ReHo measures from the Gordon cortical parcellation and Freesurfer subcortical segmentation, covering a total of 352 ROIs. BrainSwipes visual QC was used to assess the proportion of rs-fMRI data meeting quality thresholds and to evaluate its impact on distributional characteristics. The QC metric exhibited a linear trend, supporting its interpretation as a continuous measure. Examining effects of data quality, we find that data quality effects are most minimized when the pass rate for BrainSwipes QC exceeds 70%.
File-Based Imaging Data
We also analyzed mean ROI-to-ROI functional connectivity maps from the same parcellations (Gordon cortical and Freesurfer subcortical, 352 ROIs). As with tabulated data, BrainSwipes QC outputs were used to assess data quality and its influence on connectivity estimates. A similar linear relationship was observed, and QC effects were minimized when only data with at least a 70% pass rate were included.
Diffusion MRI
dMRI Workgroup
The dMRI Workgroup checked that automated QC metrics such as the neighboring DWI correlation (NDC) increase in preprocessed data compared to raw data. They also compared the Contrast to Noise Ratio (CNR) for each shell to the CNR values for the ABCC QSIPrep outputs, checking for approximately similar ranges per vendor. Postprocessed (QSIRecon) data was checked to be sure that most bundles were recovered for most scans.
Magnetic Resonance Spectroscopy (MRS)
MRS Workgroup
MRS QC is based on tabulated data-derived distributions of Osprey derivatives. R-based scripts examine distributions of MRS-derived measures from tabulated data.
See QC Summary Statistics on the HBCD Data Release Docs for some findings from these analysis shared with users.
EEG Data🔗
Electroencephalography data include both file-based and tabulated data for the tasks listed on the HBCD Data Release Docs site here. EEG QC procedures shared with users are outlined in the HBCD Docs site here. For a detailed description of QC procedures in the HBCD Study EEG protocol, refer to Fox et al., 2024.
After EEG acquisition, quality control checks are performed using EEG2BIDS Wizard, a custom MATLAB application installed at all HBCD sites. These checks are immediately provided to staff to ensure the data's integrity and usability. The process includes:
- Verifying event markers in the EEG data to confirm all required events are accurately recorded.
- Ensuring the setup for stimulus presentation and EEG data acquisition adheres to the study protocol.
- Inspecting electrode impedances to ensure they are within acceptable limits.
- Detecting multiple task runs and incomplete recordings.
- Confirming the use of correct E-Prime task versions.
In addition to the post-acquisition checks performed by the EEG2BIDS Wizard, site staff complete an EEG Acquisition Form directly in LORIS at the time of the EEG visit to document key procedural and quality control details. This form captures real-time information on net placement, participant behavior that may influence signal quality, and task completion status, ensuring protocol adherence and supporting downstream data evaluation.
The EEG Acquisition Form records:
- Net placement checks ensure electrodes are correctly positioned, using anatomical landmarks (nasion, vertex, preauricular points), and that cables are secured and symmetrical. Visual inspections are done for impedance and physical fit.
- For each phase (e.g., Resting State, VEP Task), the user reports whether data were acquired and if any problems occurred during data collection.
The EEG2BIDS Wizard additionally facilitates the transfer of data to both a dedicated SCE (secure computing environment) housed at the University of Minnesota (UMN) and to an AWS S3 bucket, each of which facilitates different aspects of QC:
UMN SCE
UMN
The Wizard handles the transfer of .mff files containing raw EEG, metadata, and personally identifiable information (PII) to the SCE. PII includes video recordings of the EEG session and photographs of EEG cap placement from multiple angles, which are used to rate quality of cap placement according to a rubric.
AWS S3 bucket
LORIS
A subset of data consisting of .set files, E-Prime stimuli files and associated non-PII metadata are uploaded to an AWS S3 bucket curated by the LORIS data management system where they are stored for subsequent processing and analysis. The contents of the AWS S3 bucket are represented on the EEG Quality Control dashboard, which is used by both study sites and the EEG Core team to access and monitor incoming EEG data and QC metrics, such as retained epochs and line noise levels.
EEG capping quality ratings are used to determine inclusion in the data release pool and subsequent processing. Photos are taken for each acquisition from the front, back, top, left, and right angles of the participant's head and uploaded via the BIDS Wizard application to a secure computing environment. They are then reviewed by the EEG Core at the University of Maryland to rate the quality of EEG net placement, or "capping quality," for each acquisition. Please see the section EEG Net Placement ("Capping Quality") Ratings in the HBCD Data Release Docs for full details.
Outputs from the HBCD-Maryland Analysis of Developmental EEG (HBCD-MADE) pipeline, which handles preprocessing and data cleaning, are also integrated into the dashboard. These outputs include key metrics like outlier statistics for specific task epochs (Debnath et al., 2020). Regular site-specific check-ins and troubleshooting are conducted to ensure consistent protocol adherence and data quality across sites.
The EEG Workgroup performs a final review of the data to be included in the release via the Lasso Pre-Release System and provides official sign off that the data is ready for release. Known issues are documented as needed on the HBCD Data Release Docs site.
Post-Release QC🔗
After data is released, additional QC is conducted in response to user-reported issues:
